

Case Study: How to Improve Your Real Estate Farming Results by 4.6X
Our case study shows exactly how agents can practice smarter real estate farming and improve their results by 4.6X the market average!
When their business is slow, agents start researching how to improve their real estate farming results and keep their pipeline full. Despite what sales gurus say, the solution to this problem can’t just be to call more, knock more, and work harder.
We were founded on the idea that the right data and tools can dramatically improve results for agents and brokerages.
Armed with the right data and technology, we’re confident that agents can work their zip codes smarter (hey, that’s where the name SmartZip came from). We now have several years of data showing exactly how our tools can help agents significantly outperform market averages for home listings.
In this article, we’ll review the results of a case study spanning 3 years of research, and show you how these results can be achieved just by targeting the right people at the right time.
Case Study Background: Proving the Results of Predictive Analytics for Real Estate Farming
Before we look at the details and the study results, here’s a little background on us.
SmartZip is a real estate farming tool that combines big data with proprietary algorithms and machine learning to accurately predict which homeowners are likely to list their properties. Using enormous amounts of homeowner data from over 20 different sources, we’re able to create a holistic picture of prospects and track information like:
-
Recent refinancing.
-
Online browsing activity.
-
Increases in home value.
-
Networth
-
Credit status
This information is helpful when you’re building a plan to effectively farm a certain area. But, does it affect the number of listings that can be secured? Does it affect how much business you can win?
What is the bottom-line impact of real estate predictive analytics tools?
To find out, we put our product to the test. After all, the data won’t lie...right? Our team of analysts compiled 3 years of data comparing the performance of our tools against the national market average.
The results were amazing, and we’re excited to show you precisely how you can produce the same impacts for your business.
Case Study Results: How Predictive Analytics Can Improve Real Estate Farming Efforts by 4.6X
The primary focus of our study was to learn exactly how well our system can predict listings in a specific zip code. To understand how well SmartZip predictive tools work, we needed to look at three key measurements:
-
The national average turnover rate (i.e. the rate at which people sell their homes).
-
Our success rate at scoring (predicting) properties that we think are likely to sell.
-
The difference between the national average and our predictions.
We won’t wait to get to the good stuff. Here are the overall results from our analysis:
Our analytics tools accurately predicted a turnover rate of nearly 27% versus the national average of only 5%. That’s a performance improvement of 4.6X!
If you’re a little bit nerdy (like us), you might be interested in seeing how these numbers were produced and the “data backstory.”
Below is the data from all 3 years, showing our performance at predicting listings in the same zip code during that time range. There are a few important concepts to know before diving in:
-
Accumulated Event rate: the total percentage of homes that were listed for sale in a specific zip code.
-
Accumulated Lift: how the turnover rate that we predicted compares to the national average. The accumulated lift shows our actual performance against the average turnover rate.
-
Scores: ranging from 100 to 900 or more, our system produces property scores based on many different pieces of homeowner data, including at least the information below:
- Total time in home.
- Number of residents.
- Home appreciation.
- Consumer habits.
- Age of home.
- Loan status.
- Much more...
Now let’s look at the data for each year to understand how results changed and improved over time.
YEAR 1 DATA
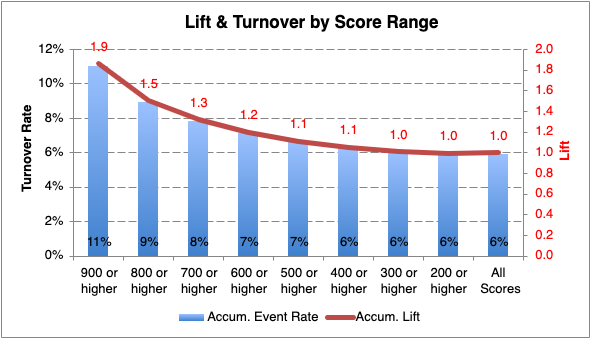
Image credit: SmartZip
During the first year we were able to outperform the national average by 1.9X, with a turnover rate of 11%. Not bad, but we knew that there was room to do better.
YEAR 2 DATA
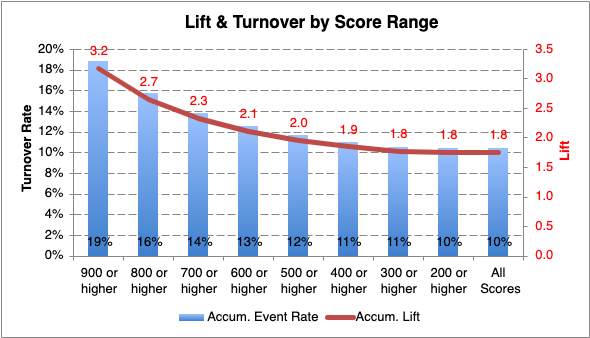
Image credit: SmartZip
In year 2 our unique combination of data and tools was able to predict a number of listings that was 3.2X higher than the national average. On the left side of the graph, you can see that the number of homes listed for sale in the 900 or higher score range is 19%. This 8% year-over-year increase shows how we were able to narrow our focus on the most valuable potential sellers.
YEAR 3 DATA
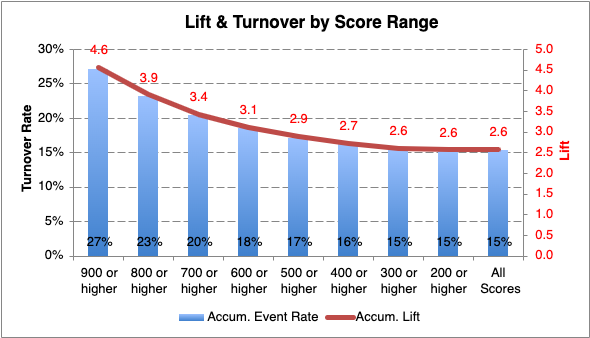
Image Credit: SmartZip
In year 3 is where we see the most dramatic results, with a turnover rate of 27% (4.6X higher than the national average).
But, that’s not all.
There’s another very important story hidden in this data.
Look at the graph from year 3 below.
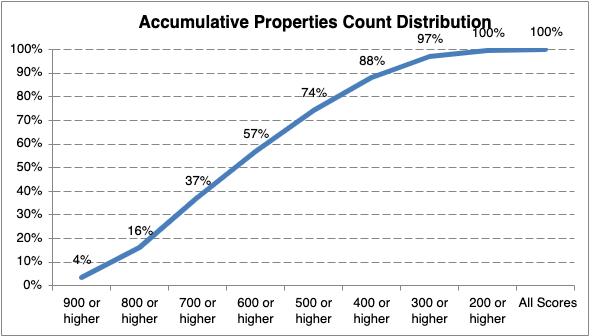
Image Credit: SmartZip
What does this graph reveal?
It’s actually pretty simple. This chart tracks the scores of all properties within our tracked zip code, from 100 (least likely to sell) up to 900 (most likely to sell).
Notice how the line goes up and to the right, which shows that highest percentage of homes (96%) score under 300, meaning that they are not likely to sell.
This graph shows that only 4% of the homes in a specific geographic region meet the criteria to score at 900 or above. These are the hot prospects. These are the ones that need to be carefully, urgently cultivated with personal attention.
Unless you’re able to look at a neighborhood or zip code and magically deduce exactly which properties are in the highest scoring category (900 or higher), you have virtually no shot at narrowing down the top 4% of potential sellers.
Using data and proven methods to narrow down that top 4% is what we do best, and we make it surprisingly easy.
How do Predictive Analytics Improve Real Estate Farming Results?
As you can see from the examples above, when it comes to real estate farming, a wider net is NOT better. Instead, you only want to spend time developing the homeowners that are most likely to sell in the near future.
The data above clearly shows the power of predictive analytics for understanding who is likely to sell. But how do you effectively reach them with multi-channel marketing? We know that you can’t spend all day managing a sophisticated marketing operation. So, we made it simple (and smart).
The agents who have game-changing success with SmartZip use our full suite of marketing tools to constantly stay in front of prospects. They will be the first phone call when a homeowner decides to list.
“SmartZip provides great marketing for a geographic farm. Because of their consistent marketing during some very tough years, I closed 19 homes in my farm in 2021. I have been marketing with them since 2014, which speaks for itself.”
- Becky Williams, Keller Williams
Predictive analytics can be used to power specific farming tactics, including postcard mailings, door-knocking, emailing, advertising, personal outreach, and more. With SmartZip you can do any of the following in just a few clicks:
- Fully customize your ideal real estate farming geography using an interactive map, then dive deep on prospect research. Sort and filter your prospects by score or any other criteria.
- Design and launch a suite of online ads to target prospects across the web.
- Create a referral-based website to drive more word-of-mouth business through targeted testimonial ads.
- Send fully-branded postcards to your exact prospects to stay top of mind.
- Keep track of your prospect’s activity with a CRM dashboard – never search for email threads or phone call histories again.
- Build branded landing pages that generate leads with a comparative market analysis, automated home valuation, or a monthly trends report.
You need to practice real estate farming. So, why not hyper-focus your efforts on exactly the right prospects? Schedule a demo today to see everything SmartZip offers, and how easy smart real estate farming can be.
“I Closed 8 deals in the first 15 months from Smart Targeting”
-Matty Patty, Keller Williams


